HELIX delta-T6 Horizontal Curves 
Video of Horizontally Curved Conveyor Belt Running Empty and then Full
Video of Horizontally Curved Conveyor Belt Running Empty and then Full - note reverse that when Empty the belt drift is towards the inside (high) of the curve but when the weight of the material is added the belt drift is to the outside (low) side of the curve. Helix allows you to calculate the belt drift under different loading and running or starting / stopping conditions. This conveyor was designed using the Helix delta-T program.
Helix delta-T version 6 has a powerful capability to design conveyors which are curved in the horizontal and vertical plane.
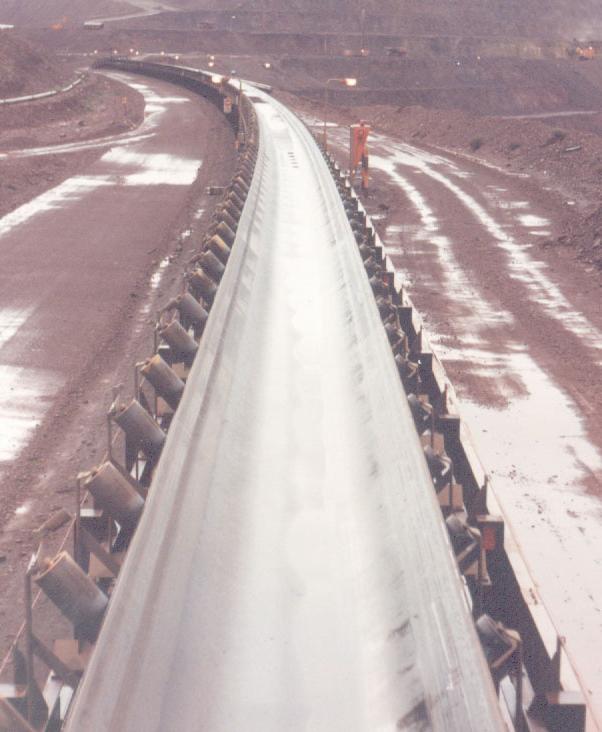
A picture of a horizontally curve conveyor is shown below - note the idlers are tilted up on the inside of the curve in order to prevent the belt from straightening and falling off the conveyor.
Horizontal Curve Calculation theory
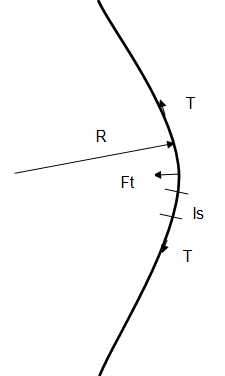
The belt tension T in a curved belt has a resultant force Ft towards the centre of the curve.
The resultant force Ft is given by:
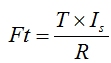 where Ft is motivating force towards centre of curve, T is belt tension, Is is idler spacing and R is horizontal
curve radius.
where Ft is motivating force towards centre of curve, T is belt tension, Is is idler spacing and R is horizontal
curve radius.
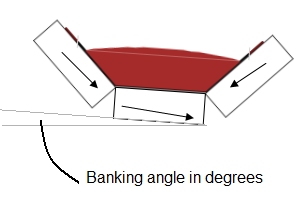
This motivating force needs to be balanced by tilting up the idler on the inside of the curve. The weight of the
belt and material (if loaded) creates a balancing force to oppose the motivating force. The trick is to know how
much to tilt the idler and ensure that the conveyor can operate under all conditions.
Negative Belt Drift - If you tilt the idlers up too much the belt will drift away from the centre of the curve and this is called a negative belt drift.
Positive Belt Drift - If the idler is not tilted up enough the forces will not be in balance and the belt will tend to drift towards the centre of the curve.
The objective is to select a banking angle which will result in negative belt drift under some operating conditions and positive belt drift under others and ensure that the belt and material will stay on the conveyor. If the banking angle required or belt drift is excessive you need to increase the curve radius or decrease the belt tension. Normally Helix Technologies aims to limit the banking angle to a maximum of about 8 degrees on the loaded side of the belt.
Horizontal Curve Calculations
To calculate the banking angles required and resulting belt drift in Horizontal curves requires you to first
input the conveyor geometry including entering the X, Y, Z co-ordinates for the points along the conveyor.
See the Entering X,Y.Z co-ordinates help topic. Once you have the conveyor geometry you can go to the Input,
Input Horizontal Curves menu on the main form. This will display the following form:
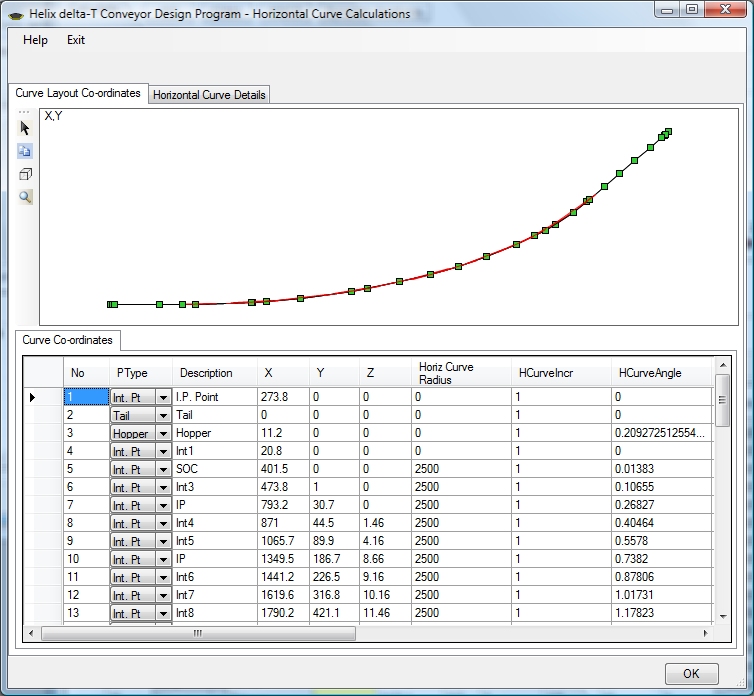
As can be seen from the above image the first sections of the conveyor are straight and the Y co-ordinates entered are all 0. Then from point 6 onwards the Y co-ordinates are increasing as the offset increases. The drawing is actually for a single horizontal curve but in order to improve accuracy of the geometry multiple points have been added along the curve path.
The radius of the curve is entered in the Horiz Curve Radius column, in this case it is a constant radius and it is drawn by the software as a red line. It is often best to draw the conveyor in a CAD drawing program and obtain the X,Y,Z points from the CAD drawing.
To calculate the banking angles required and resulting belt drift in Horizontal curves requires you to first
input the conveyor geometry including entering the X, Y, Z co-ordinates for the points along the conveyor.
See the Entering X,Y.Z co-ordinates help topic. Once you have the conveyor geometry you can go to the Input,
Input Horizontal Curves menu on the main form. This will display the following form:
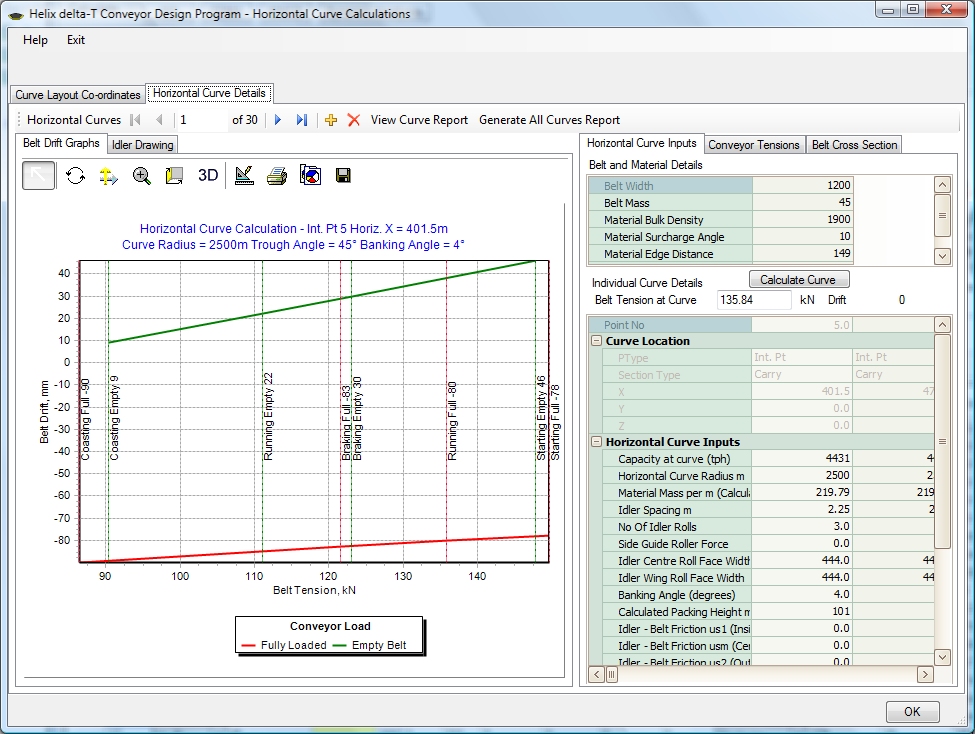
The Horizontal Curves Datacontrol above the graph allows you to scroll through all the intersection points in the conveyor that are horizontal curves. as you scroll through the curves, the details of the curve are displayed in the Horizontal Curve Inputs tabsheet on the right hand side of the form. The inputs in these tables are extracted from other input data in the program but the following inputs relate specifically to the Horizontal curves:
Horizontal Curve Radius - this is a very important input, the larger the radius the less the resultant force towards the centre of the curve. Always use the maximum radius that can be incorporated in the conveyor.
Material Mass per m - this is a calculated value from the capacity on the conveyor section.
Idler Spacing - this input affects the motivating force, see formula at top of form.
Banking Angle - this is the angle at which the idler set is tilted up on the inside of the curve. If you alter this value and press Enter, the program will re-calculate the Belt Drift for all the operating conditions of the conveyor and draw them in the main Graph on the form.
Belt Drift Graph - this graph shows the amount the belt will drift for the particular load and operating case. For instance the Starting Empty belt drift is usually the highest positive belt drift and is shown by the intersection of the green graph with the "Starting Empty" vertical line. The Braking Full (or Coasting Full if no brakes are fitted) graph will usually be the highest negative belt drift calculated.
The Idler Face Widths also affect the calculations considerably, sometimes it is necessary to use an idler roll with a longer face width than you normally would for the belt selected. Getting more belt and material load on the centre roller increase the balancing forces. Three roll idlers are better than 2 roll idlers (even on the return belt run) because 2/3 of the belt and material are balancing versus half for a two roll system.
Idler to Belt Friction - some designers allow for a friction force between the belt and idler to counter the tendency of the belt to drift up the idlers. The inputs for the us1, usm and us2 are Coulomb friction factors. Helix recommends that these are set to zero because if the belt is wet the force will be considerably reduced.
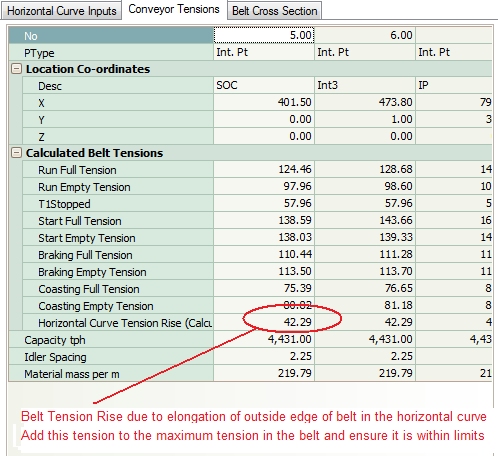
The Conveyor Tensions tab shows the belt tensions at the curve under the various operating conditions.
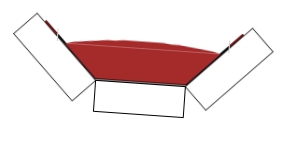
The Belt Cross Section Drawing tab shows a drawing of the carry idler tilted at the banking angle you input for the curve.
Copy dataYou can copy the Belt Drift Graphs into the Windows clipboard using the Copy button above the graph and then paste these graphs into a Word document as part of a report, or you can view and print the report using the button provided at the top of the form.
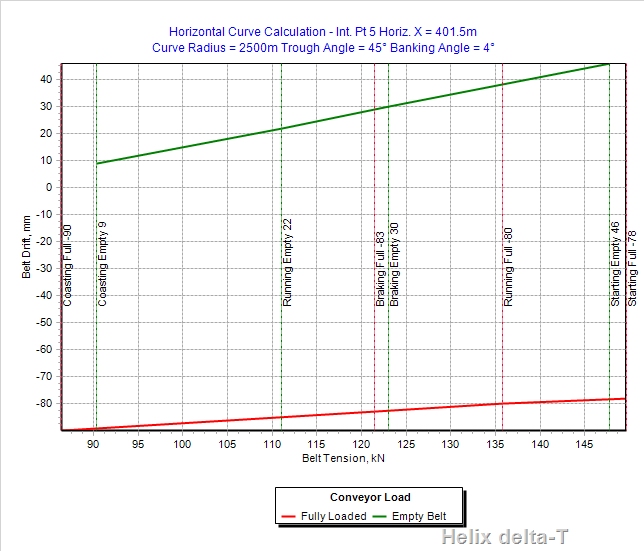
In the graph above the banking angle is bit too large because the negative drift is more than positive drift. This was done purposely on this conveyor as subsequent points along the horizontal curve have higher belt tensions resulting in more positive drift and it was decided to keep the whole curve at 4 degrees banking. you may of course vary the banking angle along the curve or even at each idler station if you wish, but this is harder to implement on site.
Adjustable Angle Idlers - it is good practice to provide a means of adjusting the banking of the idlers on site in order to allow fine tuning of the banking angle.
Side Guide Rollers - it is common to install side guide rollers to prevent the belt from slipping off the idler set completely in the case of excessive belt drift which may be cause by uneven loading or belt tension variations - refer photo at the top of this help topic for an example of the side guide rollers.
Belt Troughability - it is important the belt is flexible enough to trough correctly under the loaded and empty conditions.
Photo of Horizontally Curved Conveyor

Curved Conveyor A photo of a 4400m long 4400tph Horizontally curved conveyor with 2000kW installed power. Helix delta-T was used for the design.
Horizontal Curve Reports can be generated and printed or saved for each curve