HELIX DEM Chute Design Trace Reports 
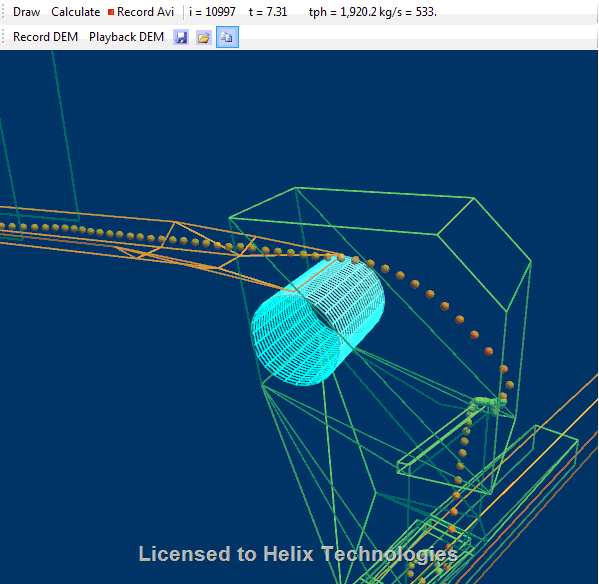
The Helix DEM software allows the recording of particle positions and velocities. Then particles can be chosen at random and their path through the transfer drawn as a trace. The image below is a trace of a single, randomly chosen particle in the model. This particle was travelling on the belt surface and is not a lump on the top of the burden.
Particle Trace Report
The trace reports give you the actual position and velocity of the particles at each time step.
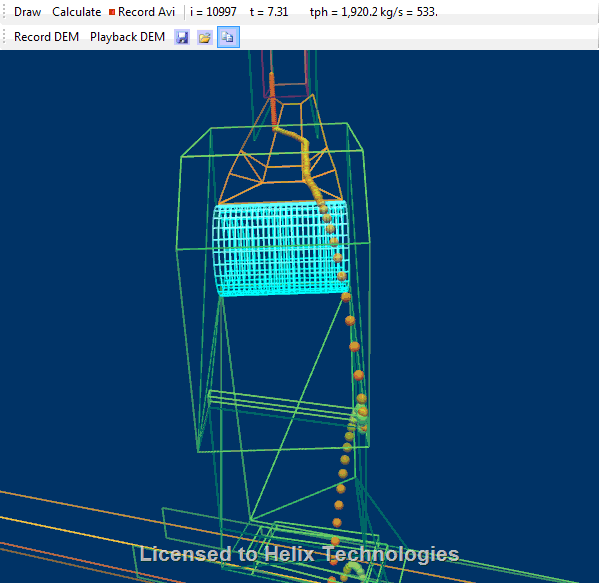
Particle Trace Report front view
Trace and Record the path of individual particles
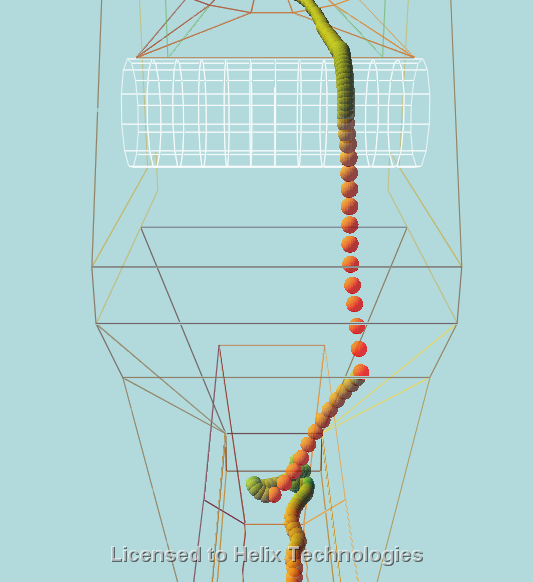
Particle Trace Report
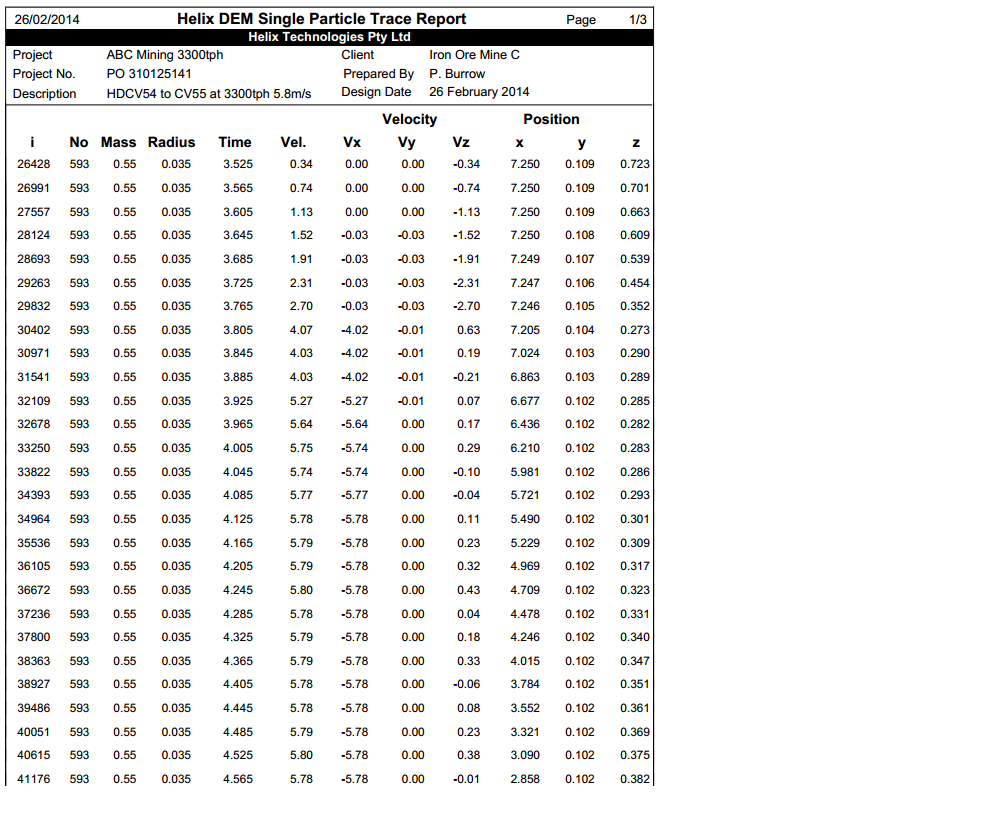
Trace Report showing position and velocity of a particle. You can also get a report showing the particle radius, particle mass, particle position in X,Y,Z co-ordinates and the velocity in X,Y,Z directions of all particles in the model, at each time step.
This means that in addition to the visual feedback of the images and videos you get real data on the particle velocities and concentrations. This allows you to calculate the average velocity in any region of the transfer and also to estimate impact energy and forces on chute surfaces. This allows you to compare different design options in order to minimise belt and chute liner wear and also to eliminate areas in the chute where material is slow moving or stationary - this is where blockages occur.
You can download a sample Particle Trace Report by clicking the following link: Particle Trace Report - pdf file
You can download a sample Helix DEM Chute Design Report by clicking the following link: DEM Chute Design Report - Word doc file