HELIX delta-T6 Dynamic Analysis - starting conveyors 
Helix delta-T version 6 has a powerful capability to allow the design Engineer to control and optimise the conveyor starting and stopping.
Conveyor Starting and Stopping Methods
Helix delta-T allows the designer to control the starting of a conveyor by means of:
- Torque Speed Control - Starting.
- Speed Time Control - Starting.
- Constant Torque Brake - Stopping braking.
- No Brake - Stopping coasting.
- Speed Time Curve Control - Stopping ramp-down.
- Add Delay times between drives starting.
- Add Delay times between brakes activating.
- The Take-up can be locked on stopping to use belt stretch tension for sag control
All of the above controls can be programmed in by entering data in the Starters Database and then using these curves to control the conveyor during the dynamic analysis.
Torque Speed Control
Torque control means that the Torque, expressed as a % of Full Load Torque is the controlled parameter at the Drive. This means that the Driving Peripheral force on the drive pulley is controlled and the magnitude of the force depends on the actual pulley speed at each time step expressed as a % of Full Load Speed.
Typical Starting Torque Curve for an Induction motor
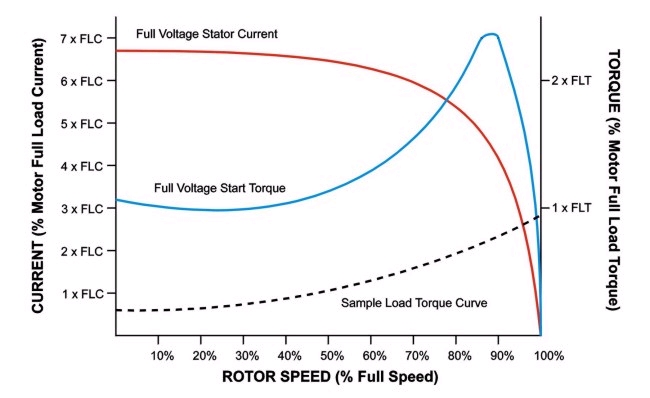
The delta-T program allows you to model each Drive's Starting Torque vs Speed characteristics. The method used is a tabular description of the % of Full Load Torque vs the % of Full load speed. All you need to do is enter the Torque % at the relevant % Speed values and the program will draw the curves for you and then use regression methods to get the actual values of Torque to apply during the dynamic analysis calculation process.
Speed Control and Regenerative Drives
The Full Load Speed and Torque and is reached when 100% Speed is reached. Note that if the conveyor tries to run at speeds above the Full load speed of the motor, the available torque from the drive drops off rapidly, and the Conveyor load will then tend to bring to reduce the speed. Above the asynchronous speed the torque is reversed ie it becomes negative and the motor acts as brake.
This overspeed braking effect is very important in Conveyor operation and Dynamic Analysis, as it helps to control the drive speed and keep it from overspeeding. For regenerative conveyors, the motor operates in the band above the 100% FL speed range and thus acts as a brake.
Load Torque vs Drive Torque
During the Dynamic Analysis calculations, the Torque supplied by the drive is applied to the drive pulley. When the Drive starts, the Starting Torque is applied and as the drive pulley accelerates, the Torque % along the curve is progressively applied until the pulley reaches 100% of Full Load speed. If the drive pulley is pushed over the full load speed by a Tension wave, the Torque reduces to below the Load Torque and the drive slows down. Eventually equilibrium is reached where the Drive Torque equals the Load Torque.
Load Sharing between Drives
If two or more induction motors are installed on a conveyor drive (or multiple drive pulleys) the motors will almost certainly have slightly different torque speed characteristics. If we examine two motors' torque speed curves close to the full load speed we may have something like the curve shown below:
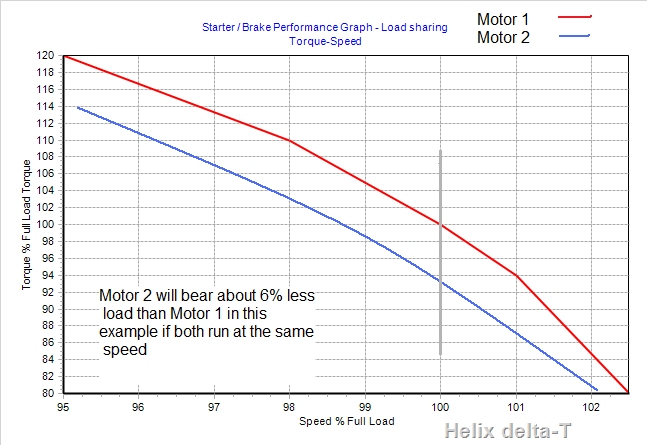
The above equilibrium explains why Squirrel Cage electric motors automatically load share. If one Drive takes less than its fair share of load, the other drives takes more share. This causes the second drive to slow down, and as it slows down, the first drive will automatically take more load.
Wound Rotor or Slip Ring Motor
Slip ring motors or wound rotor motors are a variation on the standard cage induction motors. The slip ring motor has a set of windings on the rotor which are not short circuited, but are terminated to a set of slip rings for connection to external resistors and contactors. The slip ring motor enables the starting characteristics of the motor to be totally controlled and modified to suit the load. As the motor accelerates, the value of the rotor resistance can be reduced altering the start torque curve in a manner such that the maximum torque is gradually moved towards synchronous speed. This results in a step controlled starting torque from zero speed to full speed at a relatively low starting current. The sliprings and brush assemblies need regular maintenance which is a cost not applicable to the standard cage motor.
Typical Torque Speed Curve for a Slip Ring Wound Rotor Motor
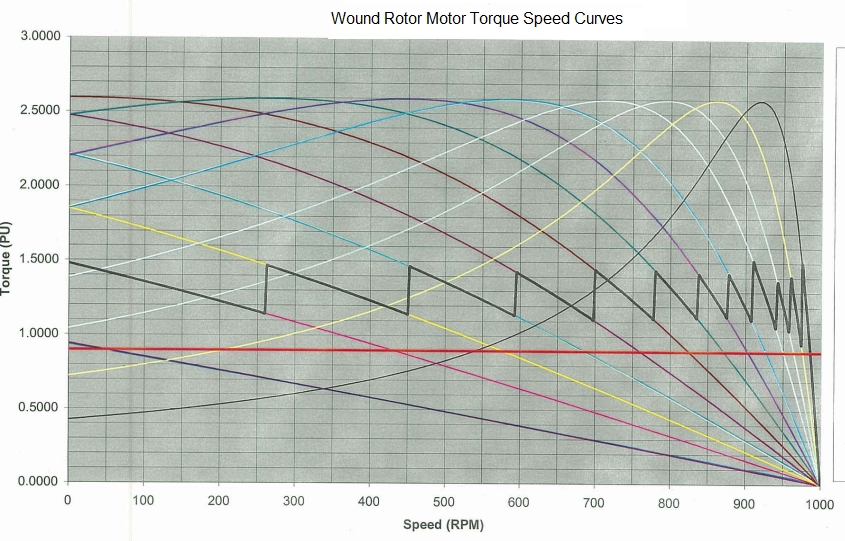
The above graph shows the motor performance when the rotor resistance is varied. The resistors can be switched on fixed time steps or on reaching a % speed setting. The Starting torque at the motor output shaft is controlled along the 'Saw Tooth' shape shown by the thick black line. Torque is drawn as a PU (Per Unit) basis above graph and is shown and input as % of full load torque in Helix delta-T.
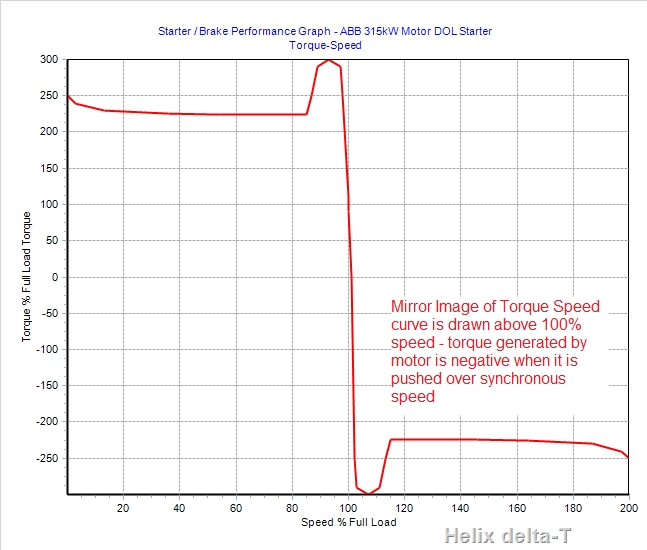
Wound Rotor Motor Speed Torque Curve Input into Delta-T
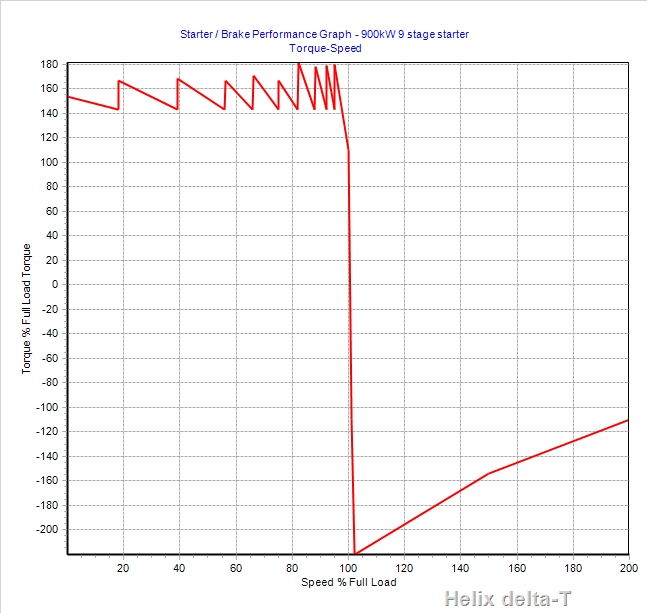
Note the speed curve is input for speeds above 100% to simulate the negative torque the motor will develop if pushed above 100% speed. Delta-T applies the calculated torque at each time step to the Drive pulley according to the relationship shown in the Torque speed Curve. This means that the program can model any Torque Speed relationship you wish.
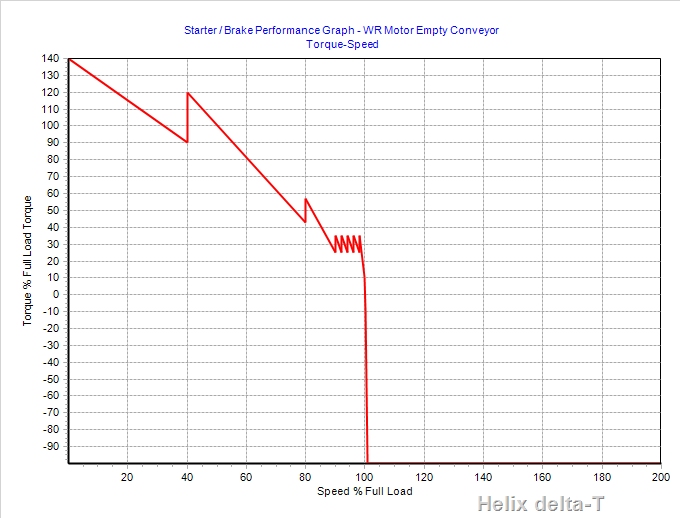
WR Switched Resistances for an Empty Conveyor
For an empty conveyor the torque speed may look something like the one below. Because the load is say only 25% to 30% of the motor FLT the conveyor will accelerate to a large degree on the first or second resistance step with the remaining acceleration occurring at closely spaced intervals until the normal run resistance is finally connected. We still need to show the negative torque curve beyond the 100% speed mark as this controls the conveyor belt speed, both in practice on actual conveyors and in the Helix Dynamic analysis calculations.
Fluid Coupling Torque Control
A Fluid Coupling is a device consisting of an impeller and a runner where the impeller is driven by the motor and torque is transmitted to the runner by fluid between the impeller and runner. This allows the motor to start freely and as fluid is drawn into the impeller / runner interface, the torque on the output shaft of the fluid coupling increase gradually until it is sufficient to move the conveyor and accelerate it. To use a Fluid Coupling Start in Helix delta-T, merely enter the output shaft Torque Speed curve for the fluid coupling as a dataset in the Torque Speed curve table. The program will then use whatever shape of curve you specify.
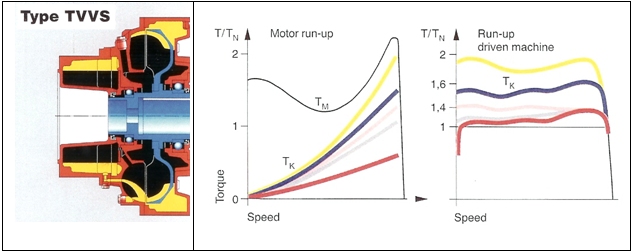
Cross sectional drawing of a soft start fluid coupling and some typical Torque speed curves - Drawing and Graphs Courtesy of Voith Transmissions.
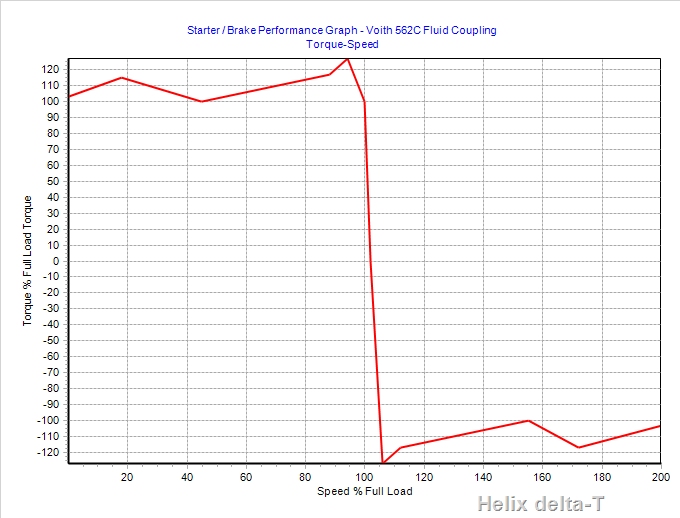
Fluid Coupling curve entered into Helix delta-T
Speed Time Control
The second method of starting control is known as Speed Control or a Velocity Ramp control. This method of control does not specify the amount of Torque applied to the Drive pulley. It specifies a pulley Speed at each time step during acceleration and sufficient Torque is applied in order to maintain the specified speed. This method of starting is usually provided by electronic solid state Variable Speed Drives which control the motor speed accurately to with fractions of a percent of Full Load Speed.
A typical linear Velocity Ramp
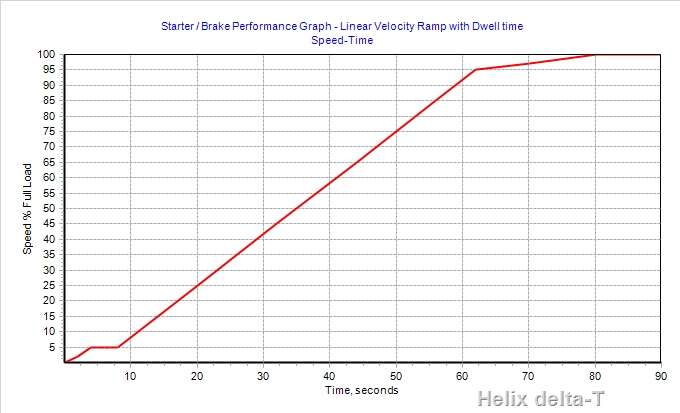
In the above starting speed ramp the speed increases linearly with time with a dwell time of 5 seconds when speed reaches 5% of speed. In this case the starter type is selected as Speed Time and the % Speed and Time in seconds are input into the starter database.
S curve Acceleration Ramps
Messers A. Harrison and L. Nordell have proposed various 'S' curve acceleration ramps. Both of these starting methods can be simulated in delta-T. Refer to the papers on these subjects in the References section for more details.
Cycloidal Front S curve - Harrison Model
This form of S curve was first proposed by Dr Alex Harrison and it is called a cycloidal front characteristic.
The cycloidal front curve is derived from:
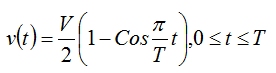
S curve - Nordell Model
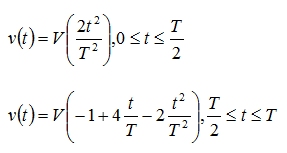
This form of S curve was first proposed by Nordell. It takes the form: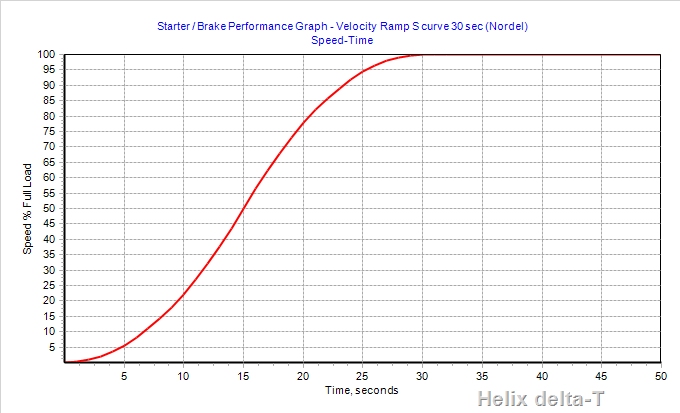
This S curve is obtained as follows:
Nordell's model has a higher acceleration (in the middle portion) than Harrison's but a lower Jerk (first derivative of acceleration)
In delta-T, you are free to use any Velocity ramp you wish - merely type in the speed time values and the program will do the rest. You can also derive your own relationships using a spreadsheet program such as Excel and then paste the values into delta-T.
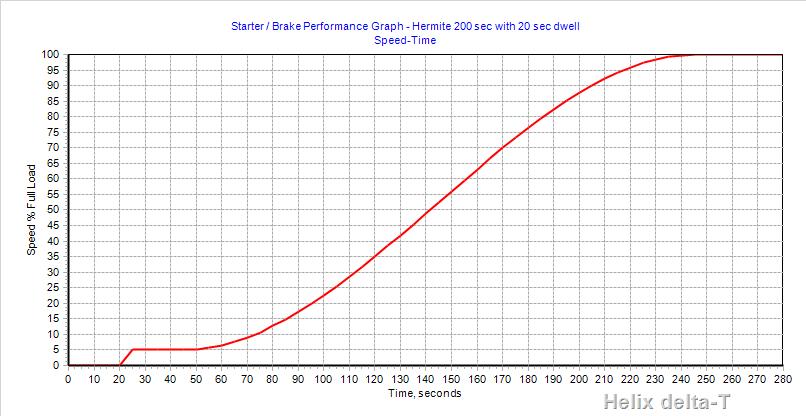
Hermite Cubic Spline Curve Starter
This shape of starting ramp allows a very soft start of the conveyor especially if a long time is used and it is also useful for conveyors with head and tail or tripper drives which are far apart. It allows a delay time to be built into the curve so that acceleration of the tail drives can be matched to the head drives. It also allows a dwell period to be added which allows the drive to start and ramp up to say 5% speed and it then holds the speed at this level for the dwell time before accelerating along the spline curve
The curve below has 20 second delay time, it then ramps up to 5% speed, holds it at this speed for a
20 second dwell time and then accelerates along a cubic spline S curve, reaching full speed after
245 seconds. Refer to Hermite Cubic Spline link for more details.
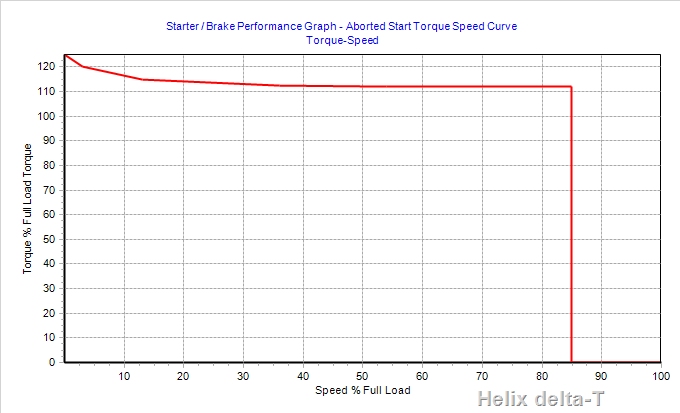
Aborted Start Torque Speed Curve
You can model an aborted start by truncating the Drive Torque vs Speed curve. For example, if the start is aborted at 85% of Full load Speed the following (simplified) Torque speed curve could be used to model the conveyor.
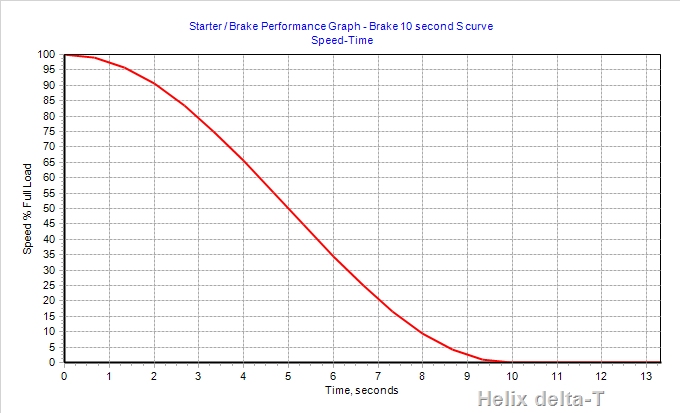
Braking
The Helix delta-T program allows you to program a Speed Time graph to apply to a braking stop. The principle is the same as the Speed time starting method except that it is applied when the conveyor is stopping. The full speed of the conveyor is taken as 100% speed and the brake pulley will follow the Speed Time you curve you input down to zero % speed. A sample is shown below.
VVVF and Variable Speed Starters
Variable Voltage Variable Frequency starters (VVVF) are basically electronic controllers which can control induction motor speed and torque by varying the electrical supply to the motor. They are also called Variable Speed Drives or VSD's. These starter can be programmed so that they will start a conveyor motor and force it follow a Speed Time curve such as the ones detailed above. They have speed loop feedback from the motor and control the motor speed to follow the programmed ramp by varying the torque the motor is developing. If the motor speed is falling behind the curve the torque is increased, if it is getting ahead of the curve the torque is decreased. This forces the motor to follow the programmed Speed Time curve. It is interesting to note the even though we program it to Speed Time parameters, it is still actually a torque control start.
These VVVF Drives can also be used to control the stopping of a conveyor by ramping down the torque in a controlled manner to follow a Speed Time curve such as the one shown under the Braking heading above. To to program this type of stopping use a Brake or Drive pulley with an S curve as shown above.
You can apply different Starting and Stopping characteristics to each individual Drive or Brake pulley (with delay times if required)