HELIX DEM Chute Design screenshots 
The following screenshots from the program show a model of a transfer with Secondary Crushed Iron ore containing large lumps mixed with fines. You can add up to 10 different feed boxes with different material properties into one transfer model.
Multiple Feed boxes
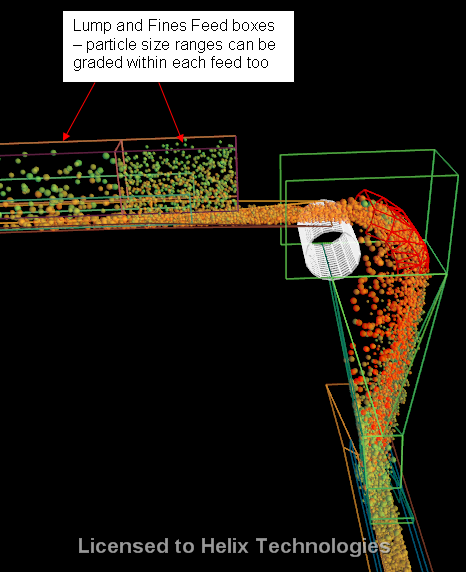
Screen shot showing Large Lump and Fine feedboxes into 90 degree transfer station - the particle colours indicate the velocity of the particle with green being slow speed and red fast speed - the user can adjust the settings and colours.
Lump and Fines Feed boxes
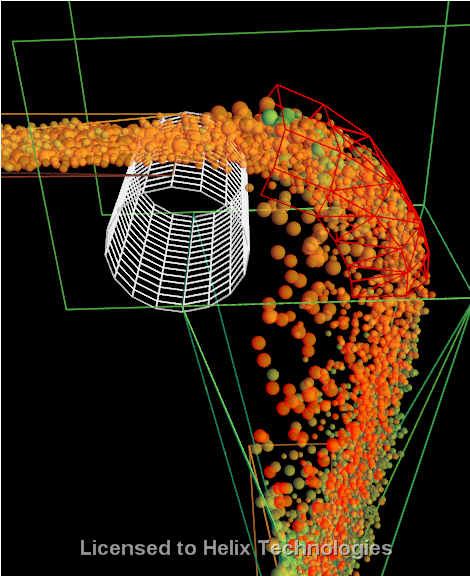
Two Feed boxes, one for lump and one for fines, each with a range of particle sizes. Also a view of a curved impact plate - note lumps behave differently to fines as they have more kinetic energy and 'punch' through the fines stream - the user can adjust the settings for co-efficient of restitution and the friction on chute surfaces. These adjustments can be applied to individual layers of the chute so that different surfaces behave differently.
Lump and Fines Segregation
This image shows material segregating with the fines on chute walls. The fines stream follows the impact plate curvature closely due to following particles pushing the particles at the impact surface back up towards the plate. The fines then exit the curved plate at the bottom edge close to sloping chute wall.
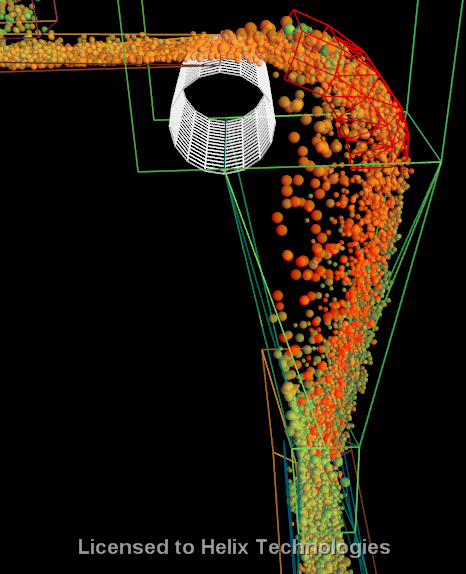
Rotate and View the model from any angle
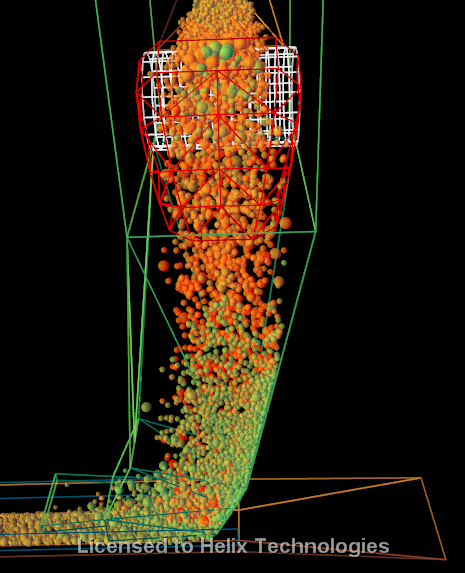
View of the transfer rotated by 90 degrees - you can rotate and view model from any angle, even whilst the DEM calculations are in progress.
Trace and Record the path of individual particles
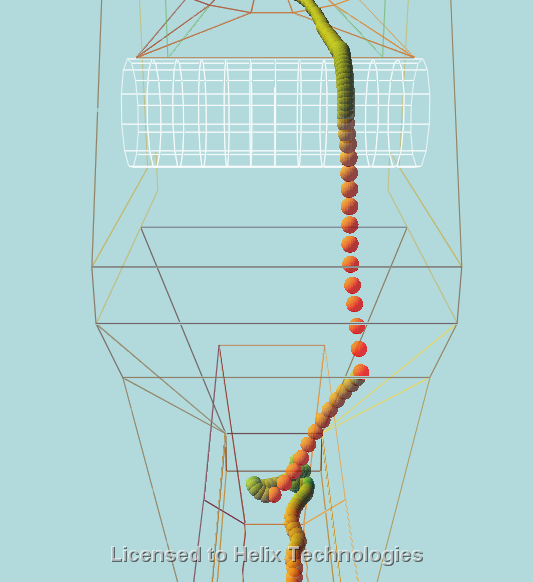
In addtion to the visual feedback and movies the program produces, you can also record the position and velocity of each particle as it moves through the transfer. The data is recorded and can be view, printed or exported to Excel for further calculations and processing.
Particle Trace Report
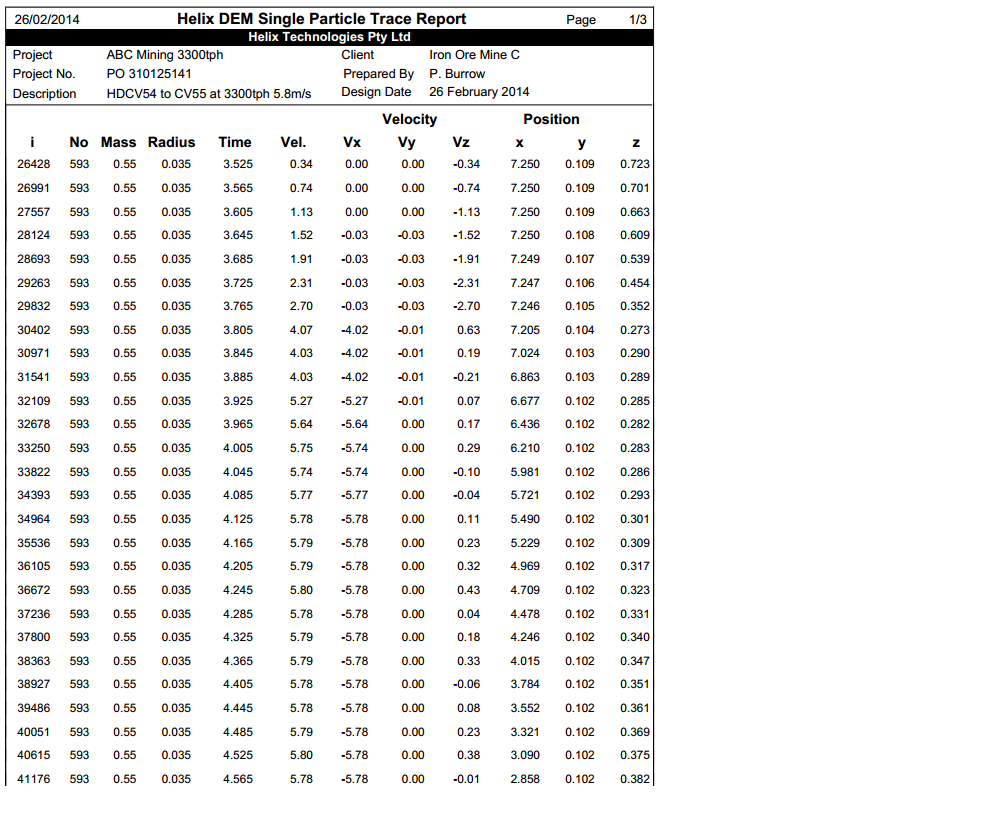
Trace Report showing position and velocity of a particle. You can also get a report showing the particle radius, particle mass, particle position in X,Y,Z co-ordinates and the velocity in X,Y,Z directions of all particles in the model, at each time step.
This means that in addition to the visual feedback of the images and videos you get real data on the particle velocities and concentrations. This allows you to calculate the average velocity in any region of the transfer and also to estimate impact energy and forces on chute surfaces. This allows you to compare different design options in order to minimise belt and chute liner wear and also to eliminate areas in the chute where material is slow moving or stationary - this is where blockages occur.
You can download a sample Particle Trace Report by clicking the following link: Particle Trace Report - pdf file
You can download a sample Helix DEM Chute Design Report by clicking the following link: DEM Chute Design Report - Word doc file